Machine Learning for Characterization and Processing
Unit 13: Course Recap — From Materials Data to Trustworthy Models

AI 4 Materials / KI-Materialtechnologie

Prof. Dr. Philipp Pelz

FAU Erlangen-Nürnberg

FAU Logo IMN Logo CENEM Logo ERC Logo Eclipse Logo

01. The course in one map

  • Fourteen weeks, twelve units, one arc: from raw materials data to models you can trust in the lab.
Units Arc
Data 1–3 What makes materials data special, how physics creates it, how quality breaks it
Representations 4–5 From handcrafted microstructure metrics to learned features
Learning under constraints 6–9 Scarcity & transfer, time series, inverse problems, characterization signals
Modern architectures & physics 10–11 Transformers; physics-informed models
Trust 12 Uncertainty you can act on

02. How to use this lecture

  • Every unit gets the same four questions:
    1. What question did the unit answer?
    2. What method answers it — and what is its central equation?
    3. When do you reach for it — and where does it break?
    4. What should you be able to do in the exam?
  • Nothing here is new. If a slide surprises you, that unit needs review.

Unit 1 — What makes materials data special?

The question: why is ML on materials data fundamentally different from mainstream ML?

  • Small data, high cost: \(10\)\(10^3\) samples, not millions.
  • Multi-scale & multi-modal: images + spectra + logs.
  • Curse of dimensionality: you cannot sample densely.
  • White / grey / black-box spectrum — pick by data size and domain knowledge.
  • CRISP-DM structures the project, question → deployment.
  • Correlation \(\neq\) causation; leakage lurks in metadata.

The grey-box strategy (Neuer et al. 2024; Sandfeld et al. 2024): \[ \sigma_y(c) = \underbrace{\Delta\sigma_{\text{SSS}}(c; \varepsilon, G)}_{\text{physics baseline}} + \underbrace{f_{\text{ML}}(c)}_{\text{data-driven residual}} \]
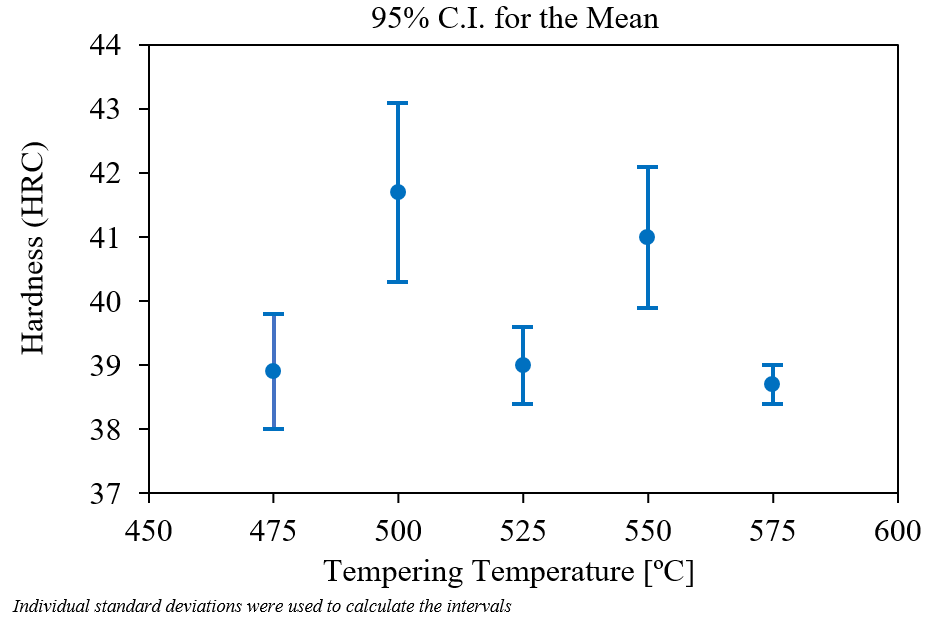
The course’s recurring dataset: hardness vs. tempering temperature with 95% confidence intervals — process→property regression with real measurement uncertainty (Mantzoukas et al. 2021).

Unit 1 — Use it when, where it breaks

Reach for it when

  • Starting any project: simple baseline first — Occam’s razor applies to materials ML.
  • Domain knowledge exists but data is too scarce for black-box learning → grey-box.
  • Before collecting data: CRISP-DM phase 1 defines the scientific ROI.

Classic pitfalls

  • Sparse high-dimensional data: no model fills a space the experiments never sampled.
  • Leakage via metadata — the network learns the microscope, not the material.
  • Spurious correlation from confounders masquerading as physics.

You should be able to

Classify the challenges of a given materials dataset (small \(n\), noise, multi-modality); choose white-, grey-, or black-box modeling for a project; structure it with CRISP-DM.

Unit 2 — Physics of data formation

The question: how does the physical chain from material property to digital number dictate model and loss design?

  • The measurement chain: physical state → probe → transducer → ADC → digital value.
  • Nyquist–Shannon and aliasing: sampling sets a hard resolution limit.
  • Point spread function: every image is the object blurred by the instrument.
  • Noise models: Gaussian (thermal), Poisson (shot noise), Weibull (failure statistics).
  • Bayes’ theorem unifies loss functions: likelihood = noise model, prior = physics.
  • Compressed sensing: sub-Nyquist sampling bought with sparsity priors.

Unit 2 — The key equations

The imaging equation — the most important of the unit (Neuer et al. 2024): \[ y(\mathbf{r}) = (h \ast x)(\mathbf{r}) + n(\mathbf{r}) \]

Bayes’ theorem, which turns the noise model into the loss function: \[ P(\boldsymbol{\theta} \mid \mathbf{X}) = \frac{P(\mathbf{X} \mid \boldsymbol{\theta})\, P(\boldsymbol{\theta})}{P(\mathbf{X})} \]

  • MSE is the Gaussian likelihood; Poisson data needs a Poisson NLL.
  • Diagnose with a variance–mean plot: \(\sigma^2 \propto \mu\) means shot noise.
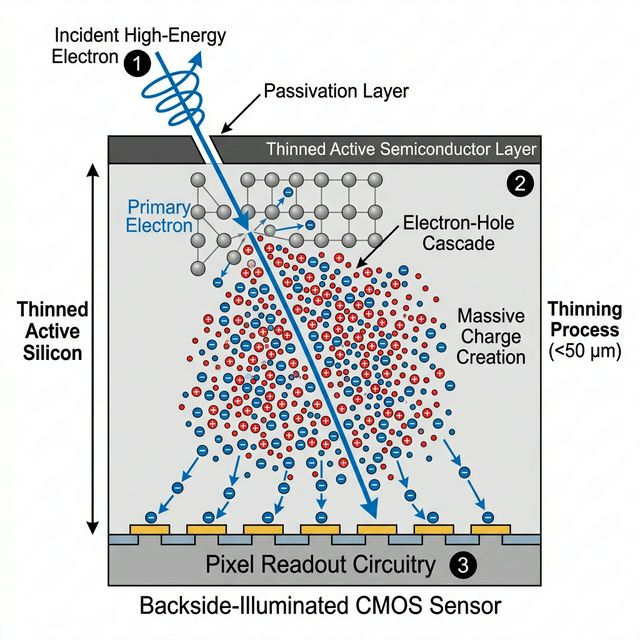
Detector architectures compared — CMOS, scintillator-coupled, and direct detection — each with its own PSF and noise character that the loss function must match.

Unit 2 — Use it when, where it breaks

Reach for it when

  • Before any model: characterize PSF, noise model, and dynamic range.
  • Low-dose EM/X-ray data → Poisson NLL, not MSE.
  • Dose-limited acquisition → compressed sensing with a sparsity prior instead of blind oversampling.

Classic pitfalls

  • MSE on Poisson data systematically underpredicts counts.
  • Aliasing, jitter, and PSF are physics, not artifacts — no network recovers what the sensor never recorded.
  • Trusting PCA components as physical modes without validation.

You should be able to

Match the five probes (electrons, photons, ions, neutrons, forces) to data formats and architectures; apply Nyquist–Shannon to judge sampling adequacy; choose the loss function from the physical noise process.

Unit 3 — Data quality, labels, and leakage

The question: how do you turn raw, messy experimental data into clean training tensors — and prove your model learned physics, not an artifact?

  • GIGO: data quality bounds model quality; errors enter at sensor, transmission, storage, and human handling.
  • Cleaning: missing values, outliers, duplicates — repaired by physics, not reflex.
  • Transforms: centering, standardization, log, FFT, wavelets — each required by specific algorithms.
  • Label uncertainty: inter-annotator disagreement is measurement noise, and it caps model performance.
  • Leakage: via preprocessing, temporal ordering, and group structure.

Unit 3 — The key equations

  • Standardization \(z_i = (x_i - \mu)/\sigma\) — required by every distance-based and regularized method.

The bias–variance decomposition for \(y = f(x) + \varepsilon\) — why validation design matters (Sandfeld et al. 2024): \[ \mathbb{E}[(\hat{y} - y)^2] = \bigl(\mathbb{E}\hat{y} - f(x)\bigr)^2 + \mathrm{Var}(\hat{y}) + \sigma^2 \]
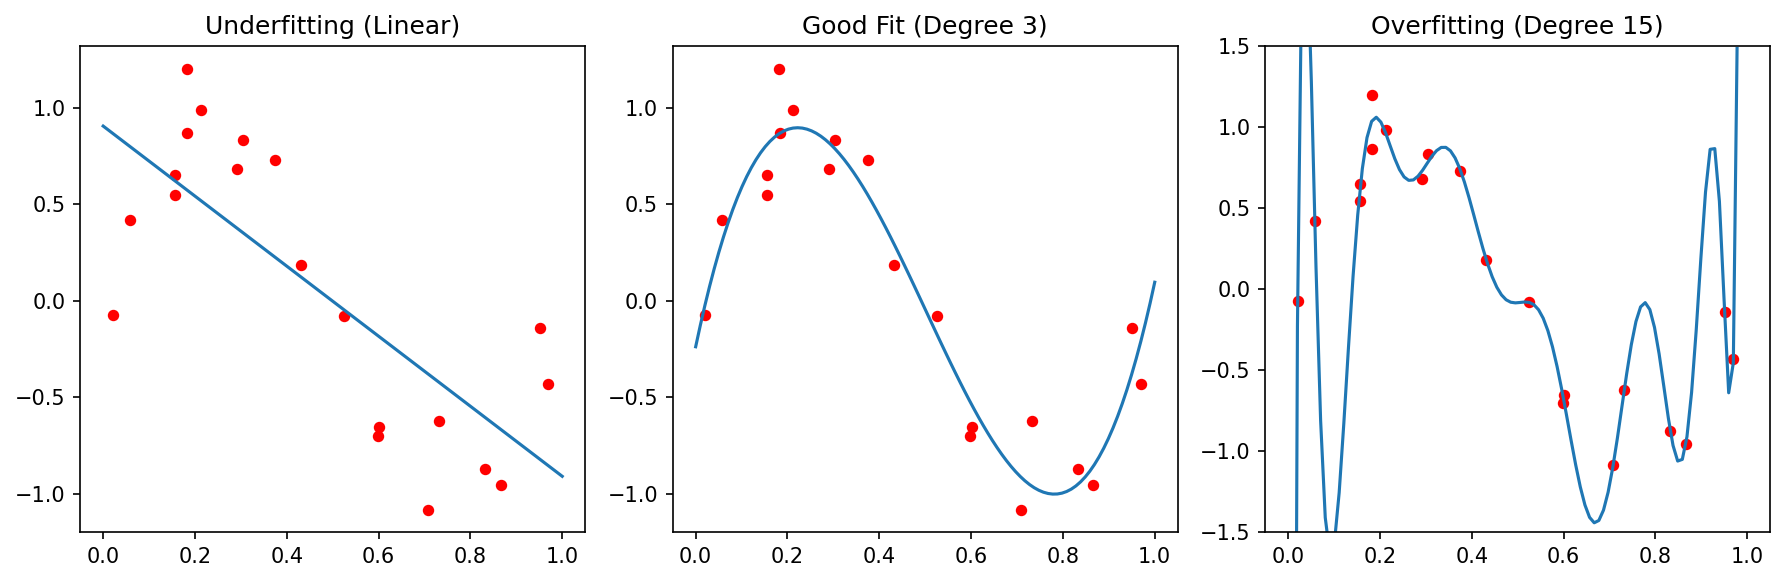
The three regimes every validation curve is trying to distinguish: too stiff (high bias), well-balanced, too flexible (high variance).

Unit 3 — Use it when, where it breaks

Reach for it when

  • Always: inspect → clean → transform → validate, in that order.
  • Grouped data (many measurements per specimen) → group-based k-fold.
  • Process data → time-aware splits; imbalanced classes → stratified folds.
  • Report confusion matrix and residual plots — never a single metric.

Classic pitfalls

  • Fitting the scaler on train+test together — test statistics leak into training.
  • Random k-fold on grouped data can inflate scores dramatically — the leak hides until deployment.
  • Removing “outliers” by 3\(\sigma\) rule deletes the rare physical events you were looking for.

You should be able to

Diagnose data-quality problems and justify each repair; explain why a given transform is needed for a given algorithm; design leakage-free validation for grouped and temporal data.

Unit 4 — From microstructure metrics to learned representations

The question: how do we encode micrographs and signals so the decision-relevant information survives — beyond a single stereological scalar?

  • Information bottleneck: collapsing a micrograph to one scalar discards most learnable physics.
  • The encoding is an upper bound on what any model can learn.
  • Structured representations: two-point statistics \(S_2\), eigen-modes, learned embeddings.
  • Convolutional inductive bias matches the translation invariance of micrographs.
  • Specimen-level splits and cross-instrument lab shift decide whether results are real.

Unit 4 — The key method

Two-point statistics generalize stereology (Sandfeld et al. 2024): \[ S_2(\mathbf{r}) = P\!\bigl(\text{phase}(\mathbf{x})=\alpha \,\wedge\, \text{phase}(\mathbf{x}+\mathbf{r})=\alpha\bigr) \]
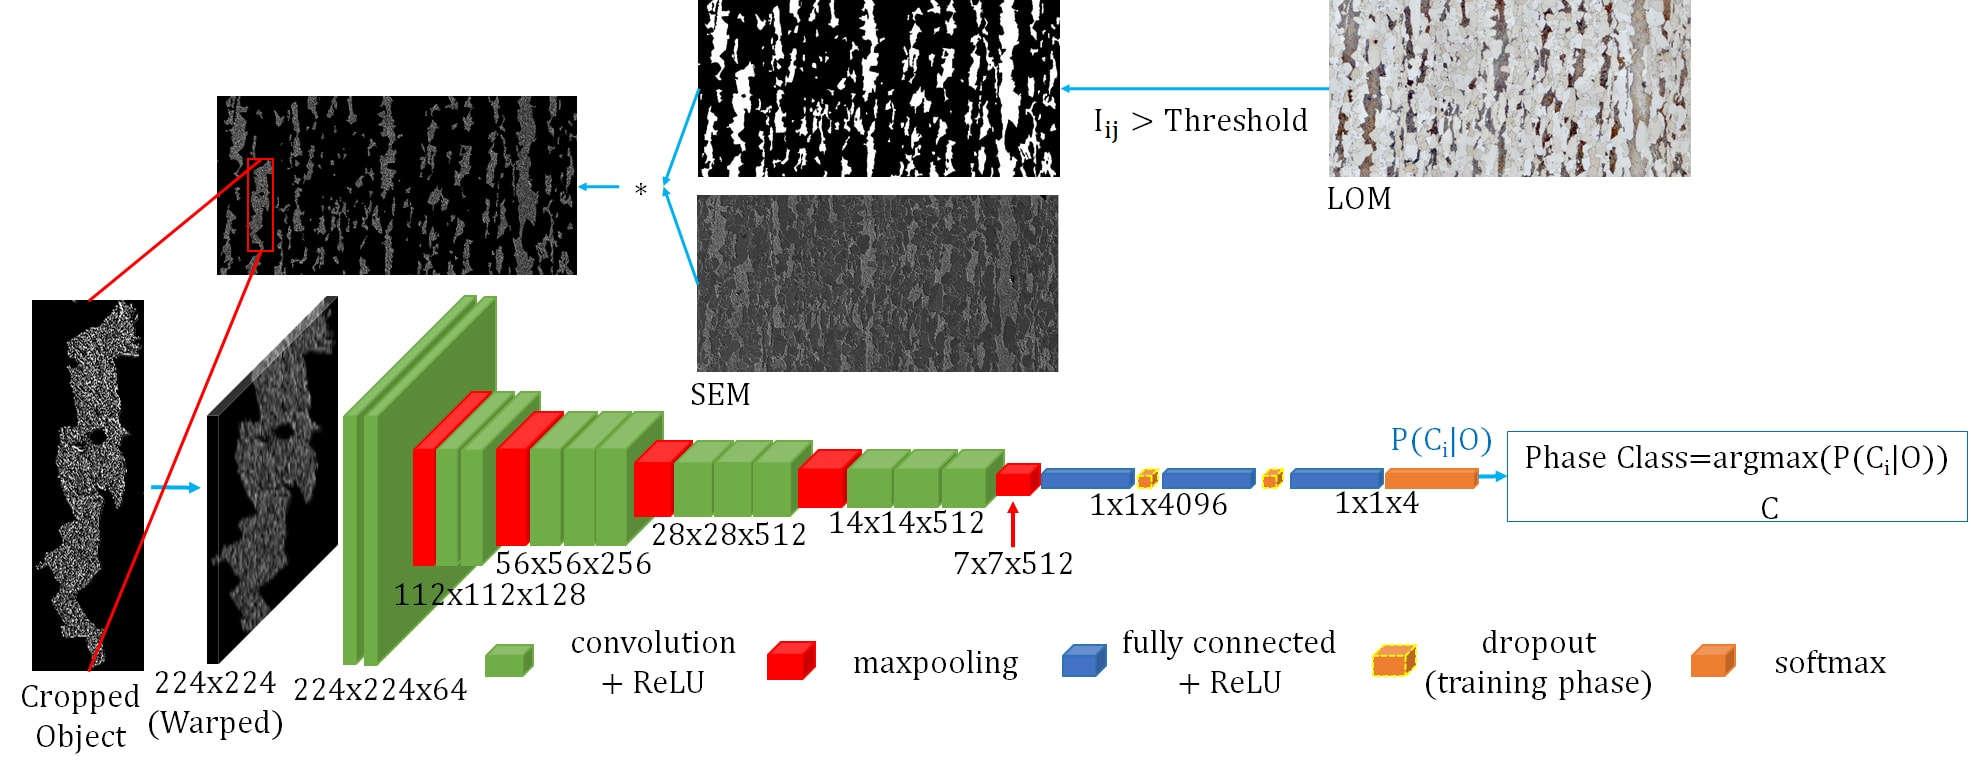
The hero result that motivated the unit: a fully convolutional network reaches 93.94% on steel constituent classification where classical pipelines reached 48.9% — the representation change alone unlocks the gain (Azimi et al. 2018).

Unit 4 — Use it when, where it breaks

Reach for it when

  • \(N < 500\) specimens or audits required → tabular composition + process features.
  • \(N \approx 10^2\)\(10^3\) and translation invariance holds → \(S_2\) / MKS pipeline.
  • \(N \gtrsim 10^3\) or simulation augmentation available → CNN on raw images.
  • Spectra (XRD, EELS, Raman) → 1-D CNN along the physical axis.

Classic pitfalls

  • Random patch splits hide specimen correlation — specimen-level splits are mandatory.
  • Lab shift: \(R^2 = 0.88\) on microscope A becomes \(0.45\) on microscope B.
  • 2% defect prevalence collapses recall to zero under accuracy-driven losses — use F1 / PR-AUC.

You should be able to

Quantify what a stereological scalar throws away; choose an encoding from \(N\), physics, and regulatory context; name three failure modes that erase apparent CNN gains.

Unit 5 — Unsupervised learning: clustering & autoencoders

The question: how do we discover structure in unlabeled materials data?

  • K-means / GMM: hard and soft clustering with interpretable centroids.
  • Frozen CNN embeddings as feature spaces for unsupervised phase and defect discovery.
  • Hyperspectral pixel clustering: flatten the datacube, cluster spectra, reimage as phase maps.
  • Convolutional autoencoders: continuous representation learning through a bottleneck.
  • Reconstruction error doubles as an anomaly score.

Unit 5 — Method I: clustering

The K-means objective (Bishop 2006): \[ \min_{\{\mu_k\},\, \{c_i\}} \sum_{i=1}^{N} \|\mathbf{x}_i - \mu_{c_i}\|_2^2 \]

  • Select \(k\) with silhouette, elbow, or BIC — and be able to defend the choice.
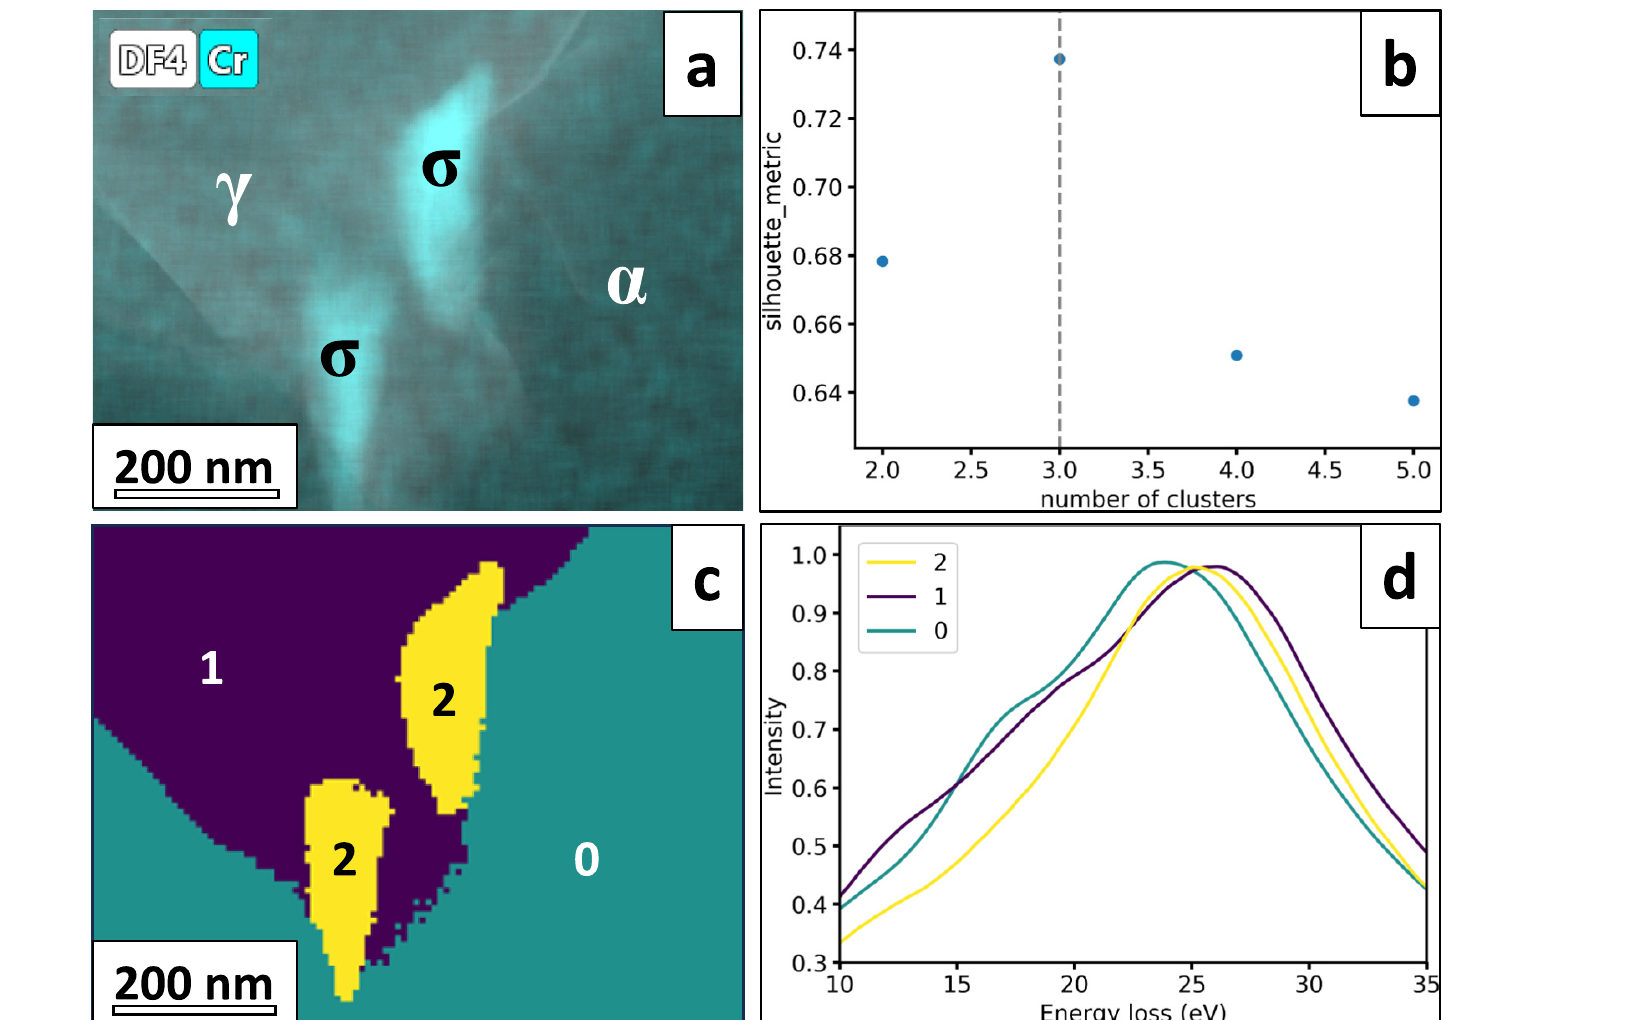
Phase mapping of industrial duplex stainless steel by K-means on low-loss EELS spectra: the cluster centroids are physically interpretable spectra.

Unit 5 — Method II: representations & autoencoders

Autoencoder objective and its anomaly score (Goodfellow et al. 2016): \[ \min_\theta\; \mathbb{E}_{x \sim \mathcal{D}}\, \|x - g_\theta(f_\theta(x))\|_2^2, \qquad a(x) = \|x - g_\theta(f_\theta(x))\|^2 \]

  • The bottleneck dimension is an inductive bias: too small underfits structure, too large learns the identity.
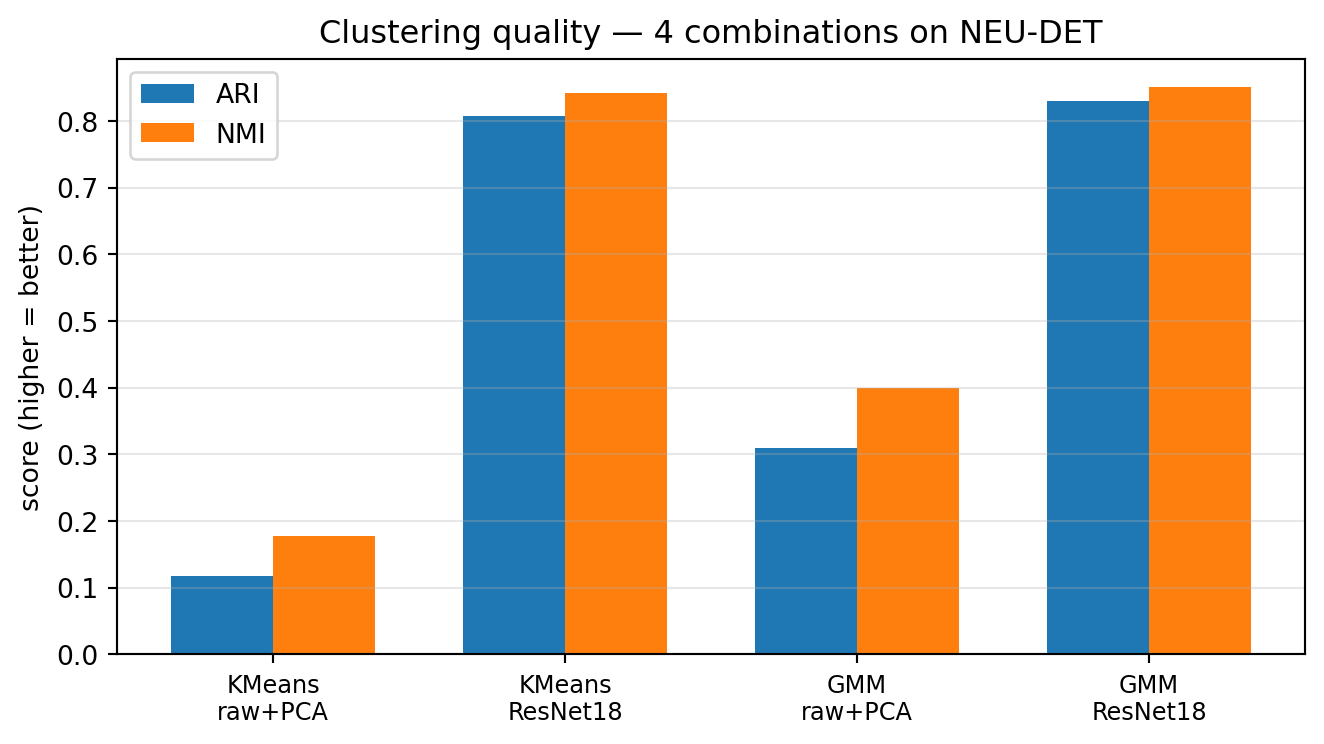
The unit’s core lesson: identical K-means, different representation — raw pixels score ARI 0.12 on NEU-DET steel defects, ResNet18 embeddings score 0.81.

Unit 5 — Use it when, where it breaks

Reach for it when

  • Discrete phases with clear separation and no labels → K-means / GMM.
  • Scarce labels but transferable morphology → cluster frozen CNN embeddings.
  • Continuous variation along a processing axis → autoencoder latents.
  • Rare, diverse, unlabeled anomalies → AE reconstruction error.

Classic pitfalls

  • Forcing clusters onto continuous structure (silhouette \(< 0.25\)) — switch to continuous representations.
  • ImageNet features can mismatch specialized modalities — inspect cluster exemplars.
  • Anomaly-detection AEs need strictly nominal training data; never tune thresholds on anomalies.

You should be able to

Run K-means/GMM with a defensible \(k\); cluster CNN embeddings and hyperspectral pixels and interpret the results; train an AE, pick the bottleneck, and deploy it as an anomaly detector with a nominal-only threshold.

Unit 6 — Data scarcity & transfer learning

The question: how can deep models work with 50–500 labeled micrographs instead of millions?

  • Transfer learning: ImageNet features transfer because early layers are generic — transferability falls with depth (Yosinski curve) (Yosinski et al. 2014).
  • Differential learning rates protect pretrained features: \[ \text{lr}_{\text{backbone}} = \frac{\text{lr}_{\text{head}}}{100} \]
  • Augmentation must preserve the physics — rotation is illegal if direction matters.
  • Synthetic data: powerful pretraining, but \(p_{\text{synth}}(x) \neq p_{\text{real}}(x)\) — the generator fails exactly on what it omits.
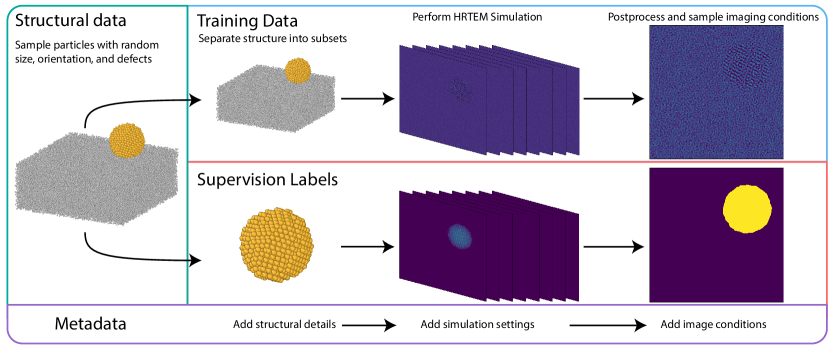
Synthetic training data with perfect labels: random nanostructures → multislice HRTEM simulation → imaging-condition post-processing.

Unit 6 — Use it when, where it breaks

Reach for it when

  • \(< 100\) labels, small domain gap → frozen feature extraction.
  • \(10^2\)\(10^3\) labels, real domain gap → fine-tuning with differential learning rates.
  • The generator captures the task physics → synthetic pretraining, then fine-tune on real labels.

Classic pitfalls

  • Specimen leakage: crops of one sample on both sides of the split.
  • Augmenting before splitting measures memorization, not generalization.
  • Full-backbone training at head learning rate → catastrophic forgetting.
  • Frozen backbones with ImageNet batch-norm statistics silently corrupt features.

You should be able to

Explain why ImageNet features transfer despite the domain gap; design a physically valid augmentation pipeline; choose feature extraction vs. fine-tuning from data size and domain gap; diagnose sim-to-real failure modes.

Unit 7 — Time series & process monitoring

The question: how do we forecast the next observation in a process stream with calibrated uncertainty, so the forecast can drive decisions?

  • LSTM/GRU: gated memory solves vanishing gradients over long sequences (Hochreiter and Schmidhuber 1997).
  • Aleatoric vs. epistemic uncertainty — sensor noise vs. model ignorance.
  • Probabilistic heads (Gaussian, mixture density) output distributions, not points.
  • Calibration: a 90% interval must contain 90% of outcomes — check it, then recalibrate.
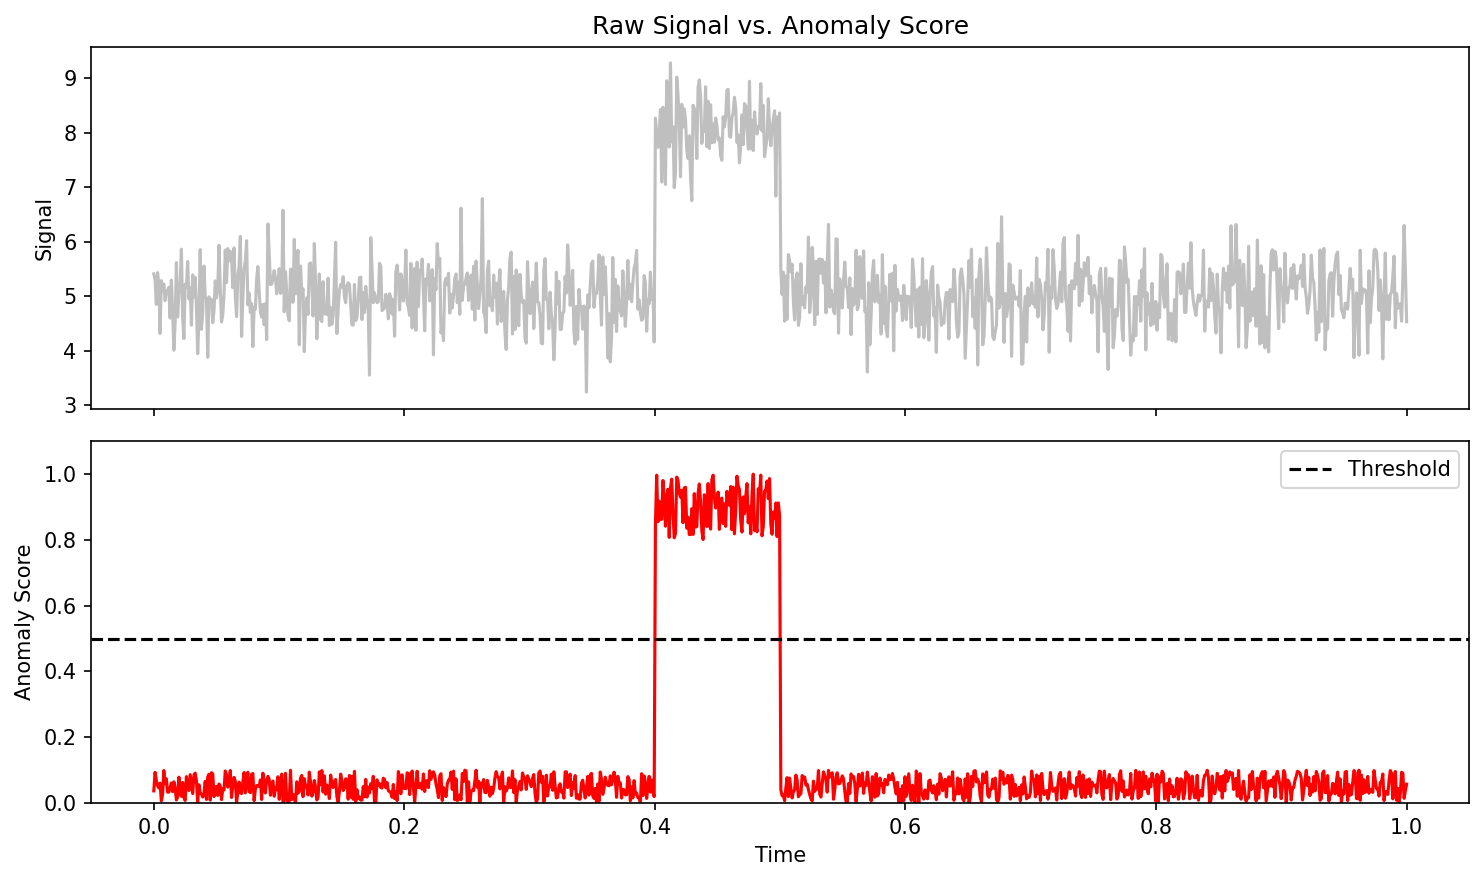
  • Anomaly detection by thresholding the predictive likelihood.

Unit 7 — The key equations

The LSTM cell update whose additive structure lets gradients flow through time: \[ C_t = f_t \odot C_{t-1} + i_t \odot \tilde C_t \]

Heteroscedastic Gaussian NLL — fit the mean and an honest variance: \[ -\log p(x_{t+1}\mid \mu_t, \sigma_t^2) = \tfrac{(x_{t+1}-\mu_t)^2}{2\sigma_t^2} + \tfrac{1}{2}\log\sigma_t^2 + \mathrm{const.} \]

The payoff: predictive likelihood drops sharply at real process events — a calibrated anomaly score with a controllable false-alarm rate.

Unit 7 — Use it when, where it breaks

Reach for it when

  • Streaming, time-ordered process data (AM, rolling, heat treatment).
  • The decision needs an interval, not a point forecast.
  • Online anomaly detection where confidence matters as much as the mean.

Classic pitfalls

  • Deterministic LSTMs minimize MSE and report false certainty.
  • Windowing before splitting → near-identical windows in train and test.
  • PyTorch’s built-in LSTM dropout does not share masks across time — naive MC dropout is silently wrong.

You should be able to

Separate aleatoric from epistemic uncertainty and estimate each; train an LSTM with an NLL head and produce calibrated intervals; read a calibration plot and recalibrate; set anomaly thresholds via predictive likelihood.

Unit 8 — Inverse problems & process maps

The question: how do we reverse the physics arrow — inferring process parameters from desired properties — when that problem is fundamentally ill-posed?

  • Hadamard’s three conditions: existence, uniqueness, stability — inverse problems violate them.
  • Regularization is prior knowledge: Tikhonov, sparsity, physics constraints.
  • Process maps: safe operating windows as intersections of defect-mechanism boundaries.
  • Inverse PINNs: infer unknown material parameters with the PDE as regularizer.
  • SINDy: discover the governing equation itself by sparse regression on a term library.

Unit 8 — The key equations

The regularized inverse problem (Neuer et al. 2024): \[ \hat{\mathbf{x}} = \arg\min_{\mathbf{x}} \|f(\mathbf{x}) - \mathbf{y}_\text{obs}\|^2 + \lambda R(\mathbf{x}) \]

SINDy — the governing equation as a sparse combination of library terms (Brunton et al. 2016): \[ \frac{d\mathbf{x}}{dt} = \boldsymbol{\Theta}(\mathbf{x})\,\boldsymbol{\xi} \]
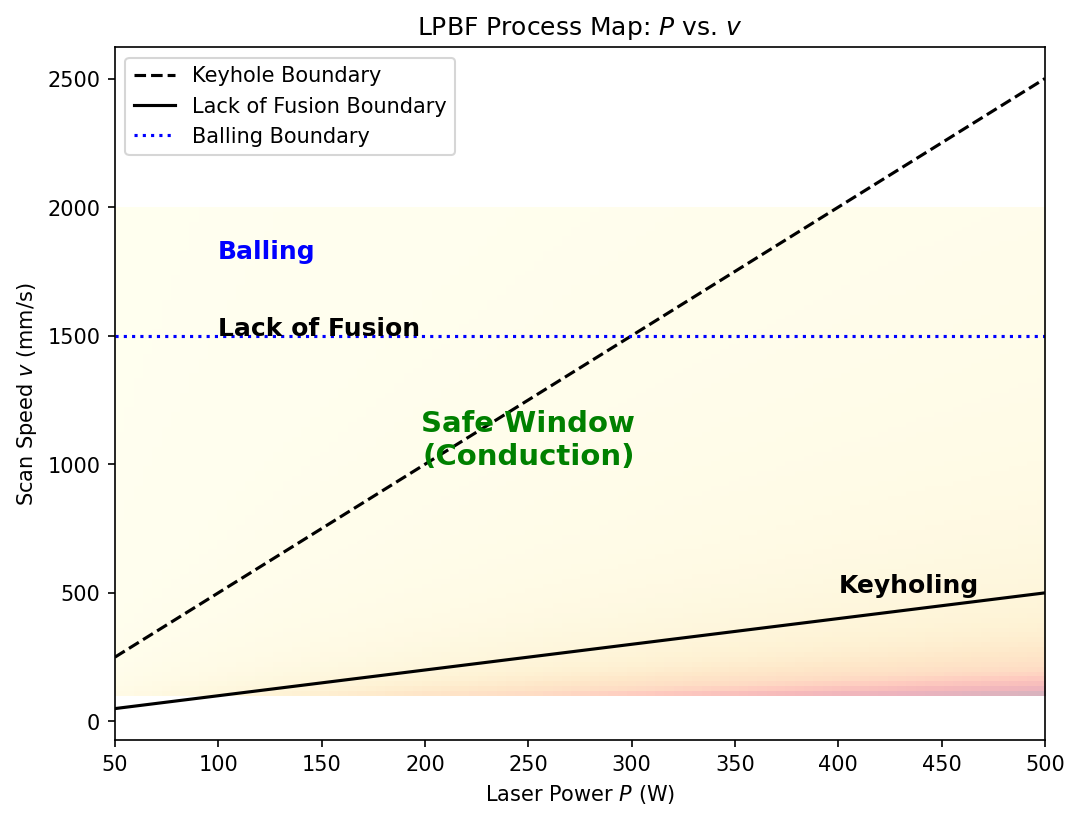
A real process map in laser power vs. scan speed: keyholing, lack-of-fusion, and balling regimes bound the safe operating window — the inverse problem as an engineer’s design space.

Unit 8 — Use it when, where it breaks

Reach for it when

  • Linear/mildly nonlinear inversion with known priors → Tikhonov / LASSO.
  • Known governing equations, unknown parameters → inverse PINN.
  • Unknown equations, interpretability required → SINDy / symbolic regression.
  • Robust manufacturing design → process maps with tolerance corridors.

Classic pitfalls

  • Non-uniqueness: MSE-trained networks return the mean of valid solutions — often infeasible.
  • Small singular values amplify noise catastrophically; instability is intrinsic, not a bug.
  • SINDy confidently fits a wrong equation if the true term is missing from the library.

You should be able to

Explain Hadamard’s conditions with a materials example for each failure; compute a safe operating window from constraint boundaries; formulate an inverse-PINN loss; design and critique a SINDy library.

Unit 9 — ML for characterization signals

The question: how does probe physics (XRD, EELS, EDX, XPS, Raman) dictate a defensible pipeline that outputs materials answers, not latent coordinates?

  • Physics dictates preprocessing: power-law background for EELS, bremsstrahlung for EDX, Shirley for XPS.
  • Calibrate the axis first, or the model learns instrumental drift instead of chemistry.
  • Poisson noise vs. systematic error: only one of them averages away.
  • Latent coordinates are not physical quantities — quantification needs constrained fits.
  • Compression erases rare phases — discoveries hide in the residual.

Unit 9 — The key method

Linear spectral unmixing — and its fundamental ambiguity (Kotula and Keenan 2006): \[ \mathbf{X} = \mathbf{C}\mathbf{S}^\top + \mathbf{E}, \qquad \mathbf{X} = (\mathbf{C}\mathbf{T})(\mathbf{T}^{-1}\mathbf{S}^\top) \]

  • Any invertible \(\mathbf{T}\) fits equally well: rotational ambiguity. Physical constraints — non-negativity, closure, selectivity, known spectra — collapse the feasible band.
  • Denoising by weighted PCA with optimal truncation (Potapov and Lubk 2019); keep the residual channel for anomaly detection.

The unit’s core architecture: every modality flows through background subtraction → calibration/alignment → normalization → deconvolution → reduction/decomposition.

Unit 9 — Use it when, where it breaks

Reach for it when

  • Choosing preprocessing: match the background model to the modality’s physics.
  • Denoising spectrum images → weighted PCA with noise-aware truncation.
  • Hunting rare phases → anomaly detection on reconstruction residuals.

Classic pitfalls

  • A 2–3% background-model error is systematic — more averaging never removes it, and it dominates the uncertainty budget.
  • PCA/AE denoising is structurally blind to rare phases and erases them.
  • A latent that separates oxidation states still isn’t a calibrated valence.

You should be able to

Build and justify a preprocessing pipeline for a given modality; explain rotational ambiguity and name constraints that resolve it; decompose an uncertainty budget into random and systematic parts and say which dominates.

Unit 10 — Transformers for materials characterization

The question: how do transformers capture long-range correlations in diffraction patterns, spectra, and process sequences — and when do they beat CNNs?

  • Attention is global mixing: every token sees every other token in one layer.
  • Tokenization + positional encoding map physical axes (detector, energy, layer index) into the model.
  • ViT: images as patch sequences (Dosovitskiy et al. 2021).
  • Flash Attention makes long sequences affordable (Dao et al. 2022).
  • Pretrain → fine-tune is the default recipe under materials-scale label budgets.

Unit 10 — Method I: attention

Scaled dot-product attention — the core mechanism (Vaswani et al. 2017): \[ \mathrm{Attn}(Q, K, V) = \mathrm{softmax}\!\left(\frac{QK^\top}{\sqrt{d_k}}\right) V \]

  • A CNN needs \(\sim L/2\) stacked \(3{\times}3\) layers to connect antipodal Bragg discs; attention does it in one.
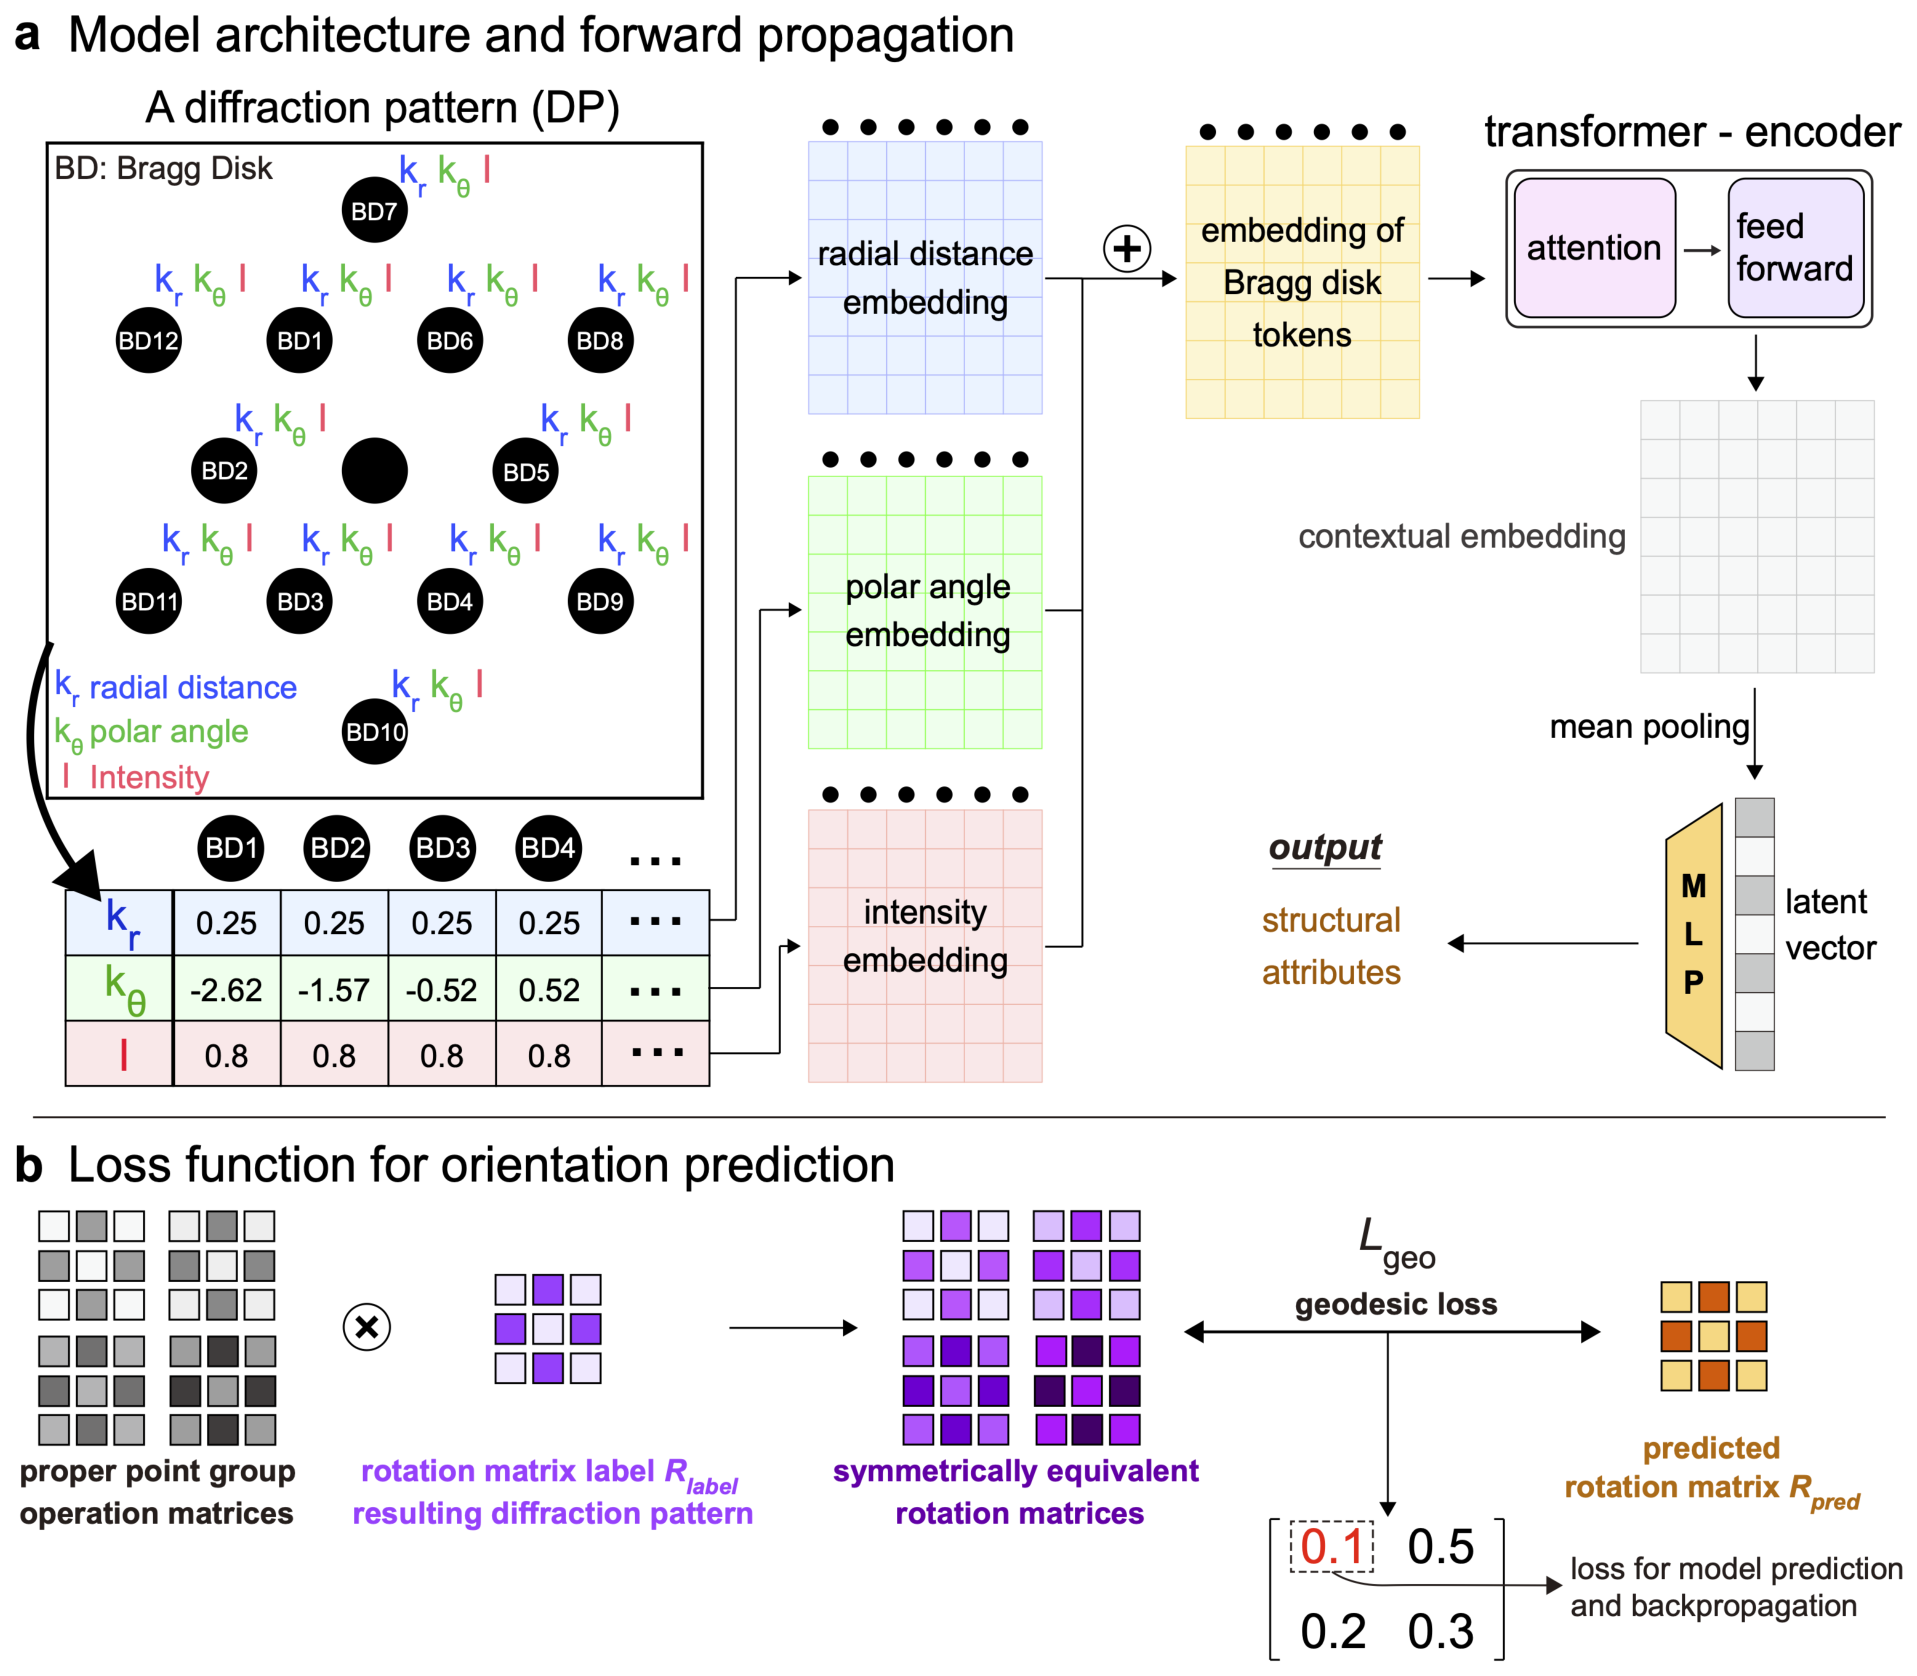
ViT applied to 4D-STEM: each Bragg disc becomes a token, and the encoder mixes all discs at once.

Unit 10 — Method II: efficiency & the training recipe

Flash Attention: tiled computation with online softmax in SRAM \[ \mathcal{O}(L^2) \;\to\; \mathcal{O}(L) \quad \text{in memory} \]

  • The label-scarce recipe: collect unlabeled data → self-supervised pretraining (MAE, DINOv2) → freeze backbone → fine-tune the head on 50–500 labels with group-wise splits.
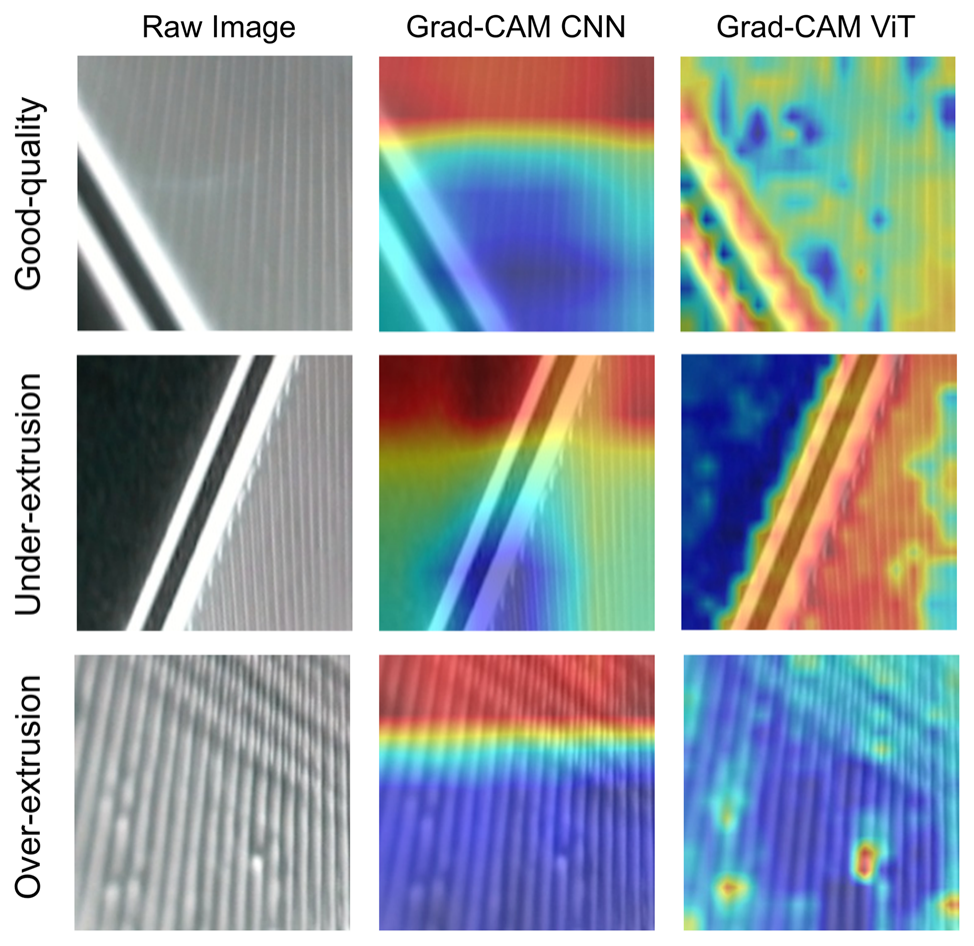
Evidence for global mixing: on FFF print-quality images, ViT attention concentrates on the defect features (gaps, blobs) where CNN saliency stays diffuse.

Unit 10 — Use it when, where it breaks

Reach for it when

  • Diffraction tasks where antipodal disc pairs and long-range geometry matter.
  • Spectra with fine-structure correlations spanning hundreds of channels.
  • Layer-to-layer continuity in tomography stacks or AM build histories.

Classic pitfalls

  • Dropped or shuffled positional encodings → a silently permutation-invariant model.
  • Absolute coordinates on crystals break translational invariance — encode periodicity instead.
  • ViT from scratch on \(< 10^4\) labels loses to ResNet18 — pretraining is not optional.
  • Dose mismatch between training and deployment fails silently.

You should be able to

Explain the receptive-field argument for attention on diffraction data; choose tokenization and positional encoding per modality; implement the pretrain→fine-tune recipe; decide transformer vs. CNN vs. GNN from data size and relationship range.

Unit 11 — Physics-informed and constrained ML

The question: how do we make networks respect physical constraints, so they cannot hallucinate impossible predictions?

  • Soft constraints: penalty terms in the loss (phase-library membership, conservation laws).
  • Hard constraints: built into the architecture (Lagaris substitution, softplus-increment monotonicity).
  • PINNs: data + PDE residual + boundary conditions in one composite loss.
  • Equivariant architectures vs. data augmentation for symmetry.
  • Neural operators (FNO/PINO): learn parametric families of PDEs (Li et al. 2024).

Unit 11 — Method I: the PINN composite loss

\[ J = J_{\text{data}} + \lambda\, J_{\text{phys}} + \lambda_b\, J_{\text{BC}} \]

  • Autodiff evaluates the PDE residual on dense collocation points; sparse measurements anchor the data term — that’s how a handful of pyrometer readings becomes a dense temperature field.
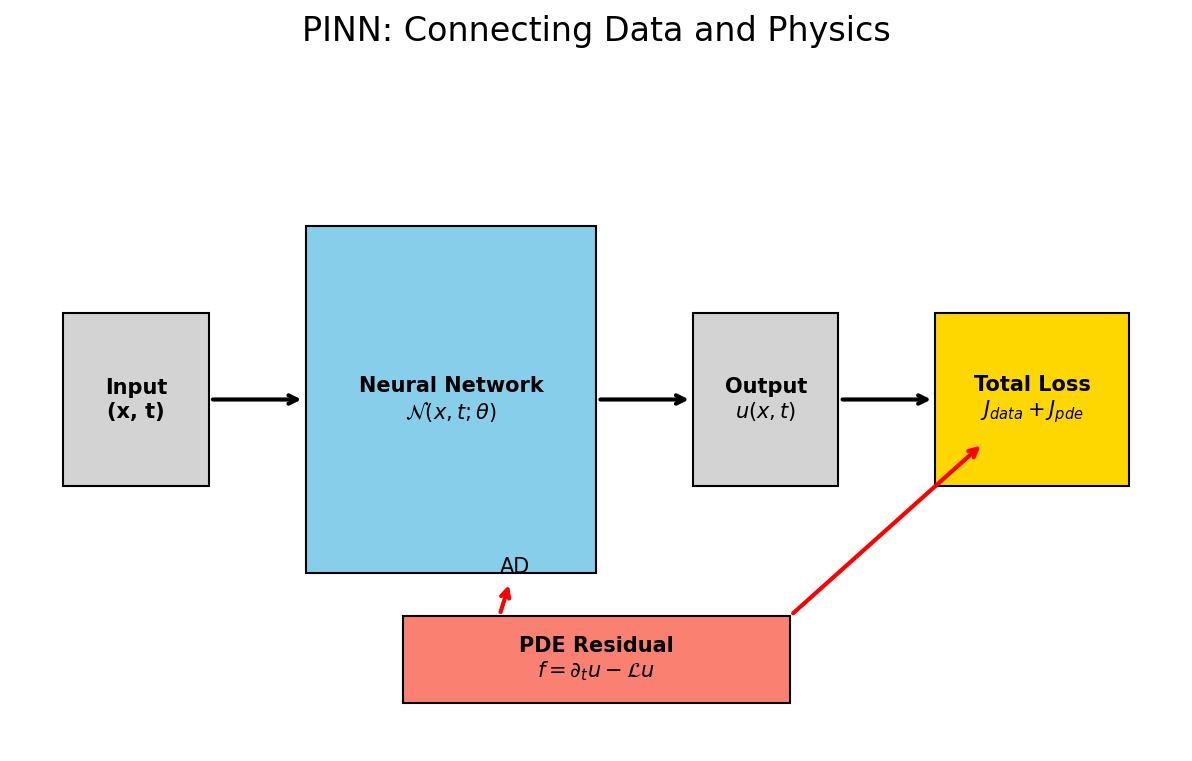
The PINN data flow: the network output feeds the data loss directly and, through automatic differentiation, the PDE residual loss.

Unit 11 — Method II: constraint patterns

  • Pattern A — soft penalty: quick, approximate, tunable via \(\lambda\).
  • Pattern B — full PINN: known PDE + sparse data → dense super-resolution between measurements.
  • Pattern C — symmetry: augmentation (cheap, approximate) vs. equivariant architecture (exact, costly).
  • Pattern D — structural: softplus increments make monotonicity mathematically exact.
  • Neural operators solve whole families of boundary conditions and geometries at inference speed.
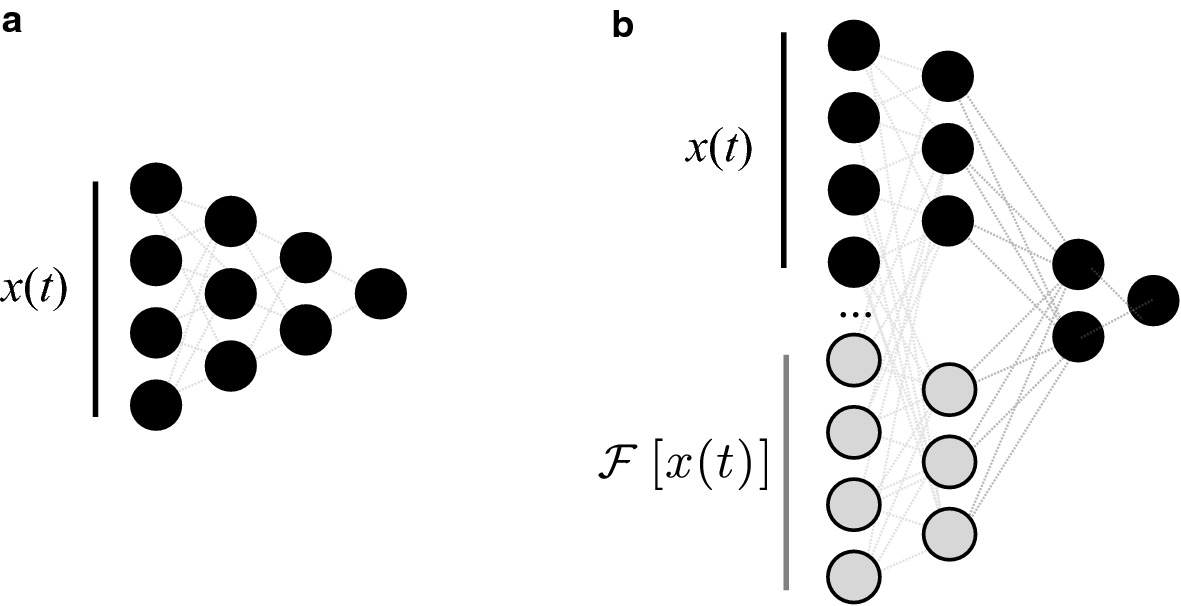
The Fourier-input idea behind FNO layers: the same network, operating on FFT-transformed inputs, sees global structure a pointwise network misses.

Unit 11 — Use it when, where it breaks

Reach for it when

  • Approximate, easy-to-encode constraints → soft penalties.
  • Known PDE + sparse sensors → PINN super-resolution.
  • Parametric PDE families (varying BCs, geometries) → neural operators.
  • Exactness required → hard structural constraints, not penalties.

Classic pitfalls

  • Gradient pathology: one loss term dominates by orders of magnitude — non-dimensionalize or reweight, don’t just raise \(\lambda\).
  • Constraint conflicts (physics says \(A \geq 0\), data says otherwise) signal calibration drift or wrong physics — diagnose, don’t suppress.
  • Constraints can mask architecture bugs: if removing them yields nonsense, fix the inductive bias.

You should be able to

Explain how a phase-library penalty prevents impossible XRD predictions; write the three-term PINN loss and state when collocation super-resolution is valid; trade augmentation against equivariance; diagnose gradient pathology.

Unit 12 — Uncertainty-aware regression & Gaussian Processes

The question: which regions of a process are safe to operate without more experiments — and how confident are you in that answer?

  • Honest UQ is a deployment requirement, not an ornament.
  • Gaussian Processes: closed-form Bayesian regression for small tabular data.
  • MC Dropout: per-pixel epistemic uncertainty from an already-trained CNN.
  • Calibration: reliability diagrams + temperature scaling before anything ships.
  • Active learning: spend the experiment budget where \(\sigma\) is largest.
  • OOD detection: refuse to predict when the input drifts off-distribution.

Unit 12 — Method I: Gaussian Processes

The RBF kernel, whose length scale \(\ell\) is a physical correlation length: \[ k_{\text{RBF}}(T, T') = \sigma_f^2 \exp\!\left(-\frac{(T - T')^2}{2\,\ell^2}\right) \]

The acquisition function that turns \(\sigma\) into an experiment plan: \[ \alpha_{\text{UCB}}(P,v) = \mu(P,v) + \beta\,\sigma(P,v) \]
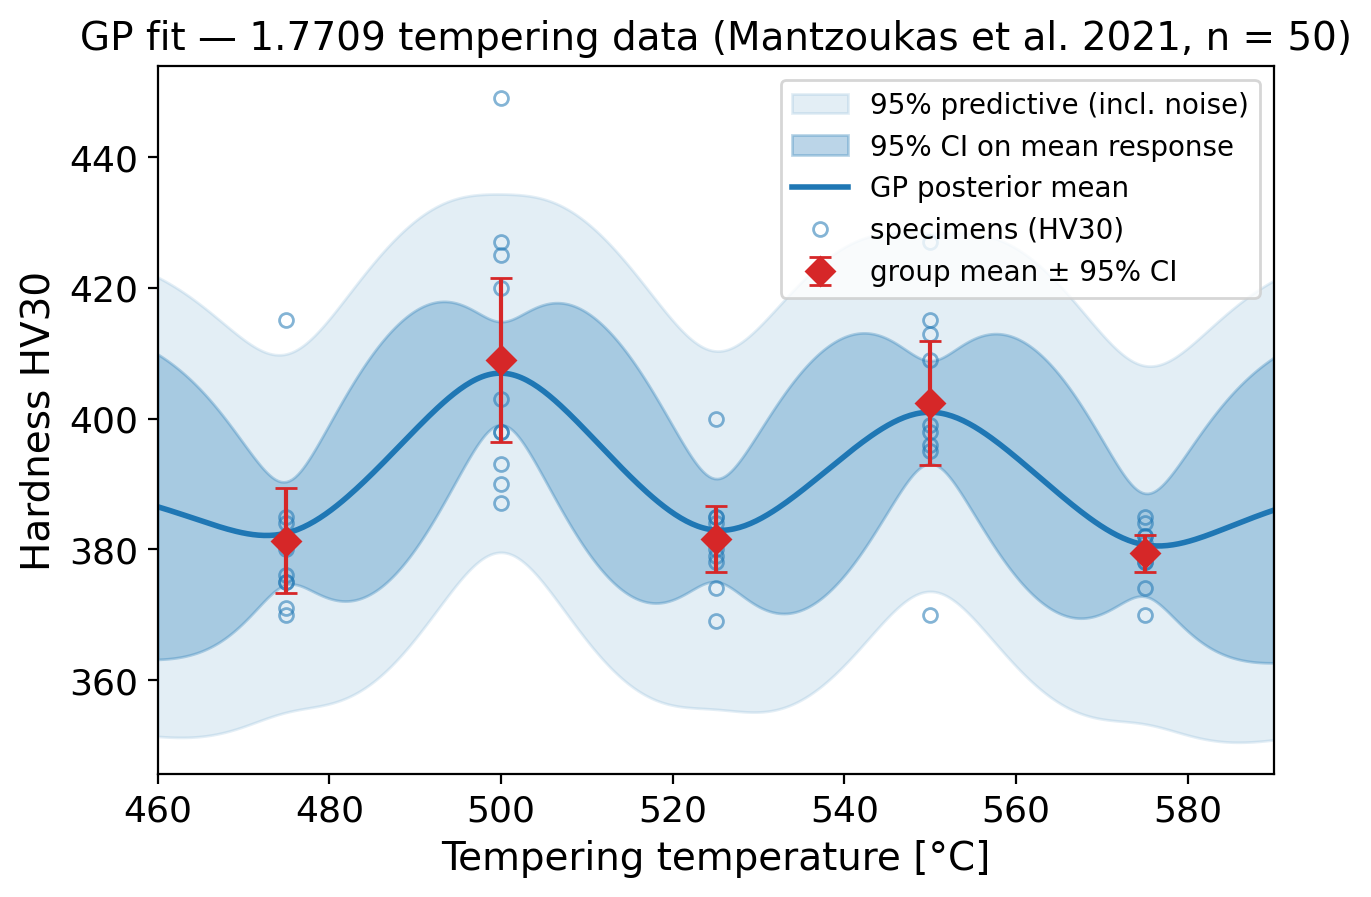
The core GP deliverable on the 21CrMoV5-7 hardness data: the confidence band narrows at the five sampled temperatures and widens between them (Mantzoukas et al. 2021).

Unit 12 — Method II: uncertainty for deep networks

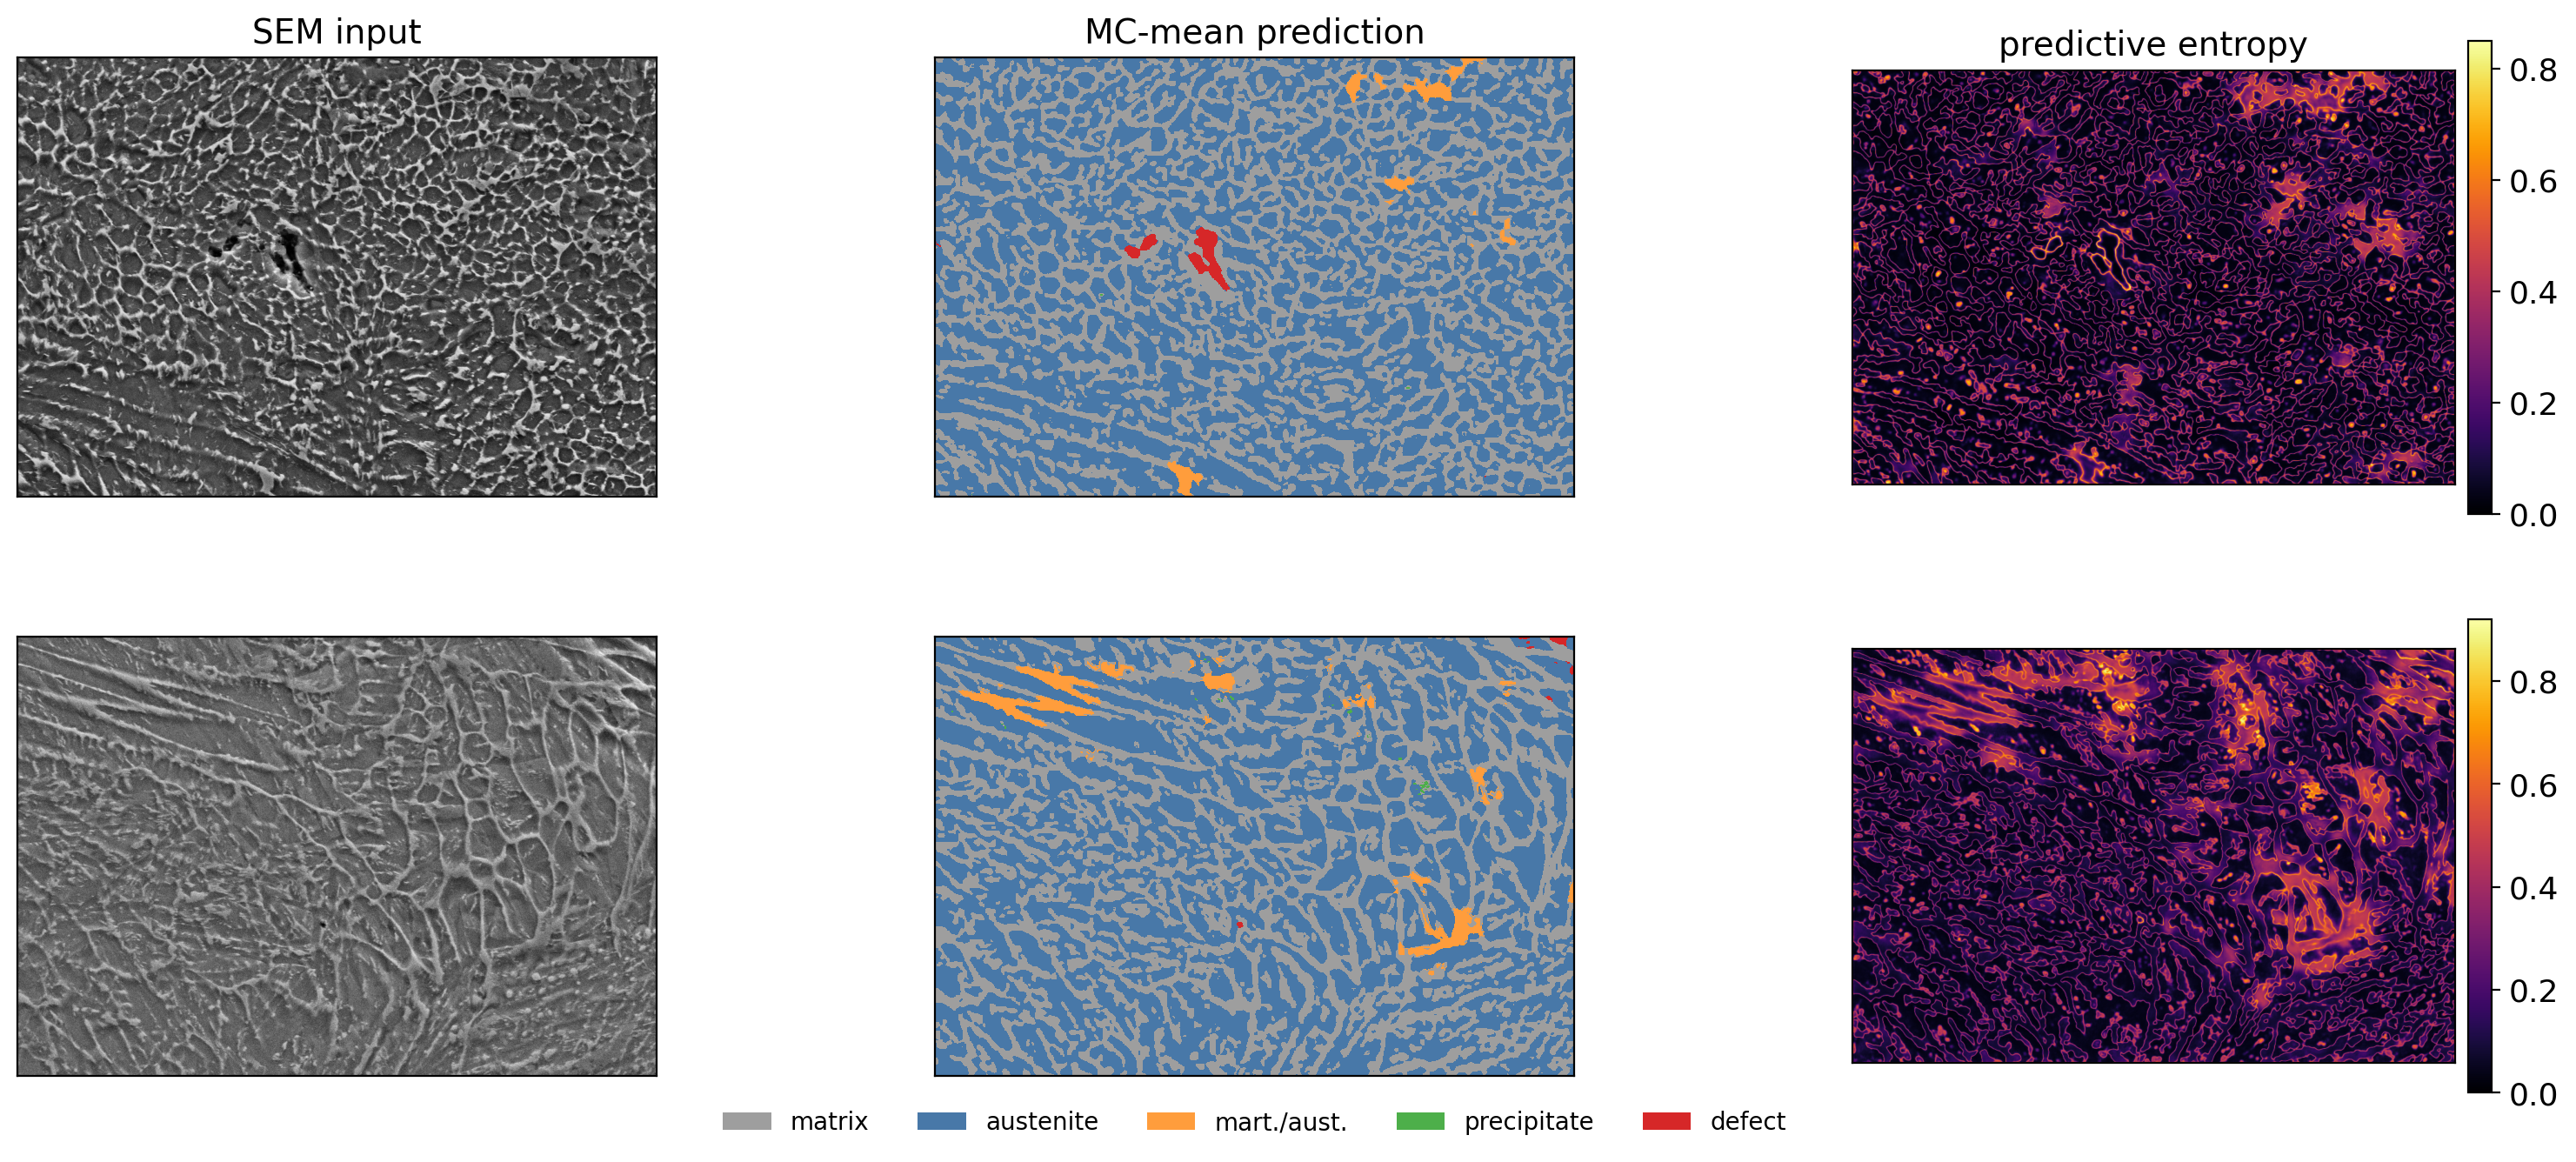
MC Dropout at inference: average \(T\) stochastic passes, report per-pixel entropy (Gal and Ghahramani 2016): \[ \bar{p}_{i,c} = \tfrac{1}{T}\sum_t p_{i,c}^{(t)}, \qquad H_i = -\sum_c \bar{p}_{i,c} \log \bar{p}_{i,c} \]

Per-pixel honesty on MetalDAM micrographs: entropy is low inside well-formed phases and high exactly where human annotators hesitate — phase boundaries and defect rims.

Unit 12 — Use it when, where it breaks

Reach for it when

  • Tabular regression, \(n \in [10, 300]\) → GP (Matérn \(\nu = 5/2\)) with interpretable length scales.
  • Trained CNN needs per-pixel uncertainty → MC Dropout (\(T \approx 30\)), no retraining.
  • High-stakes prediction with retraining budget → deep ensembles.
  • Process-window exploration → active learning with UCB/EI; the unit’s L-PBF case study mapped the window with 31 experiments instead of a 196-point grid.

Classic pitfalls

  • Raw softmax as confidence: modern NNs are systematically overconfident — temperature scaling is mandatory.
  • Calibrating on a random split misses the distribution shift that breaks deployment.
  • Calibration does not fix OOD: a perfectly calibrated model still needs a detector to refuse off-distribution inputs.

You should be able to

Choose a UQ method per task and budget; fit and physically interpret a GP; build and audit an active-learning loop; construct a reliability diagram and apply temperature scaling.

Synthesis

One course, one decision guide

The decision guide — which tool for which problem?

Your situation Reach for Unit
Tabular, small \(n\), need error bars Gaussian Process 12
Trained NN, need cheap per-pixel uncertainty MC Dropout / deep ensembles 12
Few labels, related big dataset exists Transfer learning + differential LRs 6
No labels at all Clustering, CNN embeddings, autoencoders 5
Spectra / diffraction with known probe physics Physics-matched preprocessing + constrained unmixing 9
Streaming sensor data, decisions on forecasts Probabilistic LSTM + calibration 7
Properties known, parameters wanted Regularized inversion, inverse PINN, SINDy 8
Known PDE, sparse sensors PINN super-resolution 11
Long-range correlations, pretraining available Transformers (ViT + Flash Attention) 10
Micrographs → properties Representation choice by \(N\): \(S_2\) → CNN 4

The two questions that precede every model

  • Where did this data come from?
    • Units 1–3: the physics of formation, the noise model, the leakage paths. Most project failures happen here — before any model is trained.
  • How wrong can I afford to be?
    • Unit 12: calibrated uncertainty is what turns a prediction into a decision. Without it, a forecast is a suggestion.

What happens next

  • Exam: the “you should be able to…” checkpoints in this deck are the coverage map.
  • Full mathematical depth for every method: the MFML lecture notes and the course notebooks at ECLIPSE-Lab/Ai4MatLectures.

Closing thought

  • ML did not replace the materials scientist this semester — it amplified one.
  • The skill you actually trained: translating between a physical question and a learnable objective — in both directions.
  • The best models are those that work in the lab, not just on a benchmark.

Continue

References

Azimi, Seyed Majid, Dominik Britz, Michael Engstler, Mario Fritz, and Frank Mücklich. 2018. “Advanced Steel Microstructural Classification by Deep Learning Methods.” Scientific Reports 8 (1): 2128. https://doi.org/10.1038/s41598-018-20037-5.
Bishop, Christopher M. 2006. Pattern Recognition and Machine Learning. Springer.
Brunton, Steven L., Joshua L. Proctor, and J. Nathan Kutz. 2016. “Discovering Governing Equations from Data by Sparse Identification of Nonlinear Dynamical Systems.” Proceedings of the National Academy of Sciences 113 (15): 3932–37. https://doi.org/10.1073/pnas.1517411113.
Dao, Tri, Daniel Y. Fu, Stefano Ermon, Atri Rudra, and Christopher Ré. 2022. “FlashAttention: Fast and Memory-Efficient Exact Attention with IO-Awareness.” Advances in Neural Information Processing Systems.
Dosovitskiy, Alexey, Lucas Beyer, Alexander Kolesnikov, et al. 2021. “An Image Is Worth 16x16 Words: Transformers for Image Recognition at Scale.” International Conference on Learning Representations (ICLR).
Gal, Yarin, and Zoubin Ghahramani. 2016. “Dropout as a Bayesian Approximation: Representing Model Uncertainty in Deep Learning.” International Conference on Machine Learning, 1050–59. https://proceedings.mlr.press/v48/gal16.pdf.
Goodfellow, Ian, Yoshua Bengio, and Aaron Courville. 2016. Deep Learning. MIT Press.
Hochreiter, Sepp, and Jürgen Schmidhuber. 1997. “Long Short-Term Memory.” Neural Computation 9 (8): 1735–80. https://doi.org/10.1162/neco.1997.9.8.1735.
Kotula, Paul G., and Michael R. Keenan. 2006. “Application of Multivariate Statistical Analysis to STEM x-Ray Spectral Images: Interfacial Analysis in Microelectronics.” Microscopy and Microanalysis 12 (6): 538–44. https://doi.org/10.1017/S1431927606060636.
Lakshminarayanan, Balaji, Alexander Pritzel, and Charles Blundell. 2017. “Simple and Scalable Predictive Uncertainty Estimation Using Deep Ensembles.” Advances in Neural Information Processing Systems 30. https://papers.nips.cc/paper_files/paper/2017/hash/9ef2ed4b7fd2c810847ffa5fa85bce38-Abstract.html.
Li, Zongyi, Hongkai Zheng, Nikola Kovachki, et al. 2024. “Physics-Informed Neural Operator for Learning Partial Differential Equations.” ACM/IMS Journal of Data Science 1 (3): 1–27.
Mantzoukas, John, Dimitris G. Papageorgiou, Carmen Medrea, and Constantinos Stergiou. 2021. “Hardness Behavior of W. Nr. 1.7709 Steel, Oil Quenched and Tempered Between 475–575 c.” MATEC Web of Conferences 349: 02005. https://doi.org/10.1051/matecconf/202134902005.
Neuer, Michael et al. 2024. Machine Learning for Engineers: Introduction to Physics-Informed, Explainable Learning Methods for AI in Engineering Applications. Springer Nature.
Potapov, Pavel, and Axel Lubk. 2019. “Optimal Principal Component Analysis of STEM XEDS Spectrum Images.” Advanced Structural and Chemical Imaging 5 (1): 4. https://doi.org/10.1186/s40679-019-0066-0.
Sandfeld, Stefan et al. 2024. Materials Data Science. Springer.
Vaswani, Ashish, Noam Shazeer, Niki Parmar, et al. 2017. “Attention Is All You Need.” Advances in Neural Information Processing Systems 30.
Yosinski, Jason, Jeff Clune, Yoshua Bengio, and Hod Lipson. 2014. “How Transferable Are Features in Deep Neural Networks?” Advances in Neural Information Processing Systems 27.